
Knowledge about process control, without the noise.
Practical articles on PID controllers, process dynamics and recognising unrest in your process. Written for everyone who works with a plant, from control room to management.
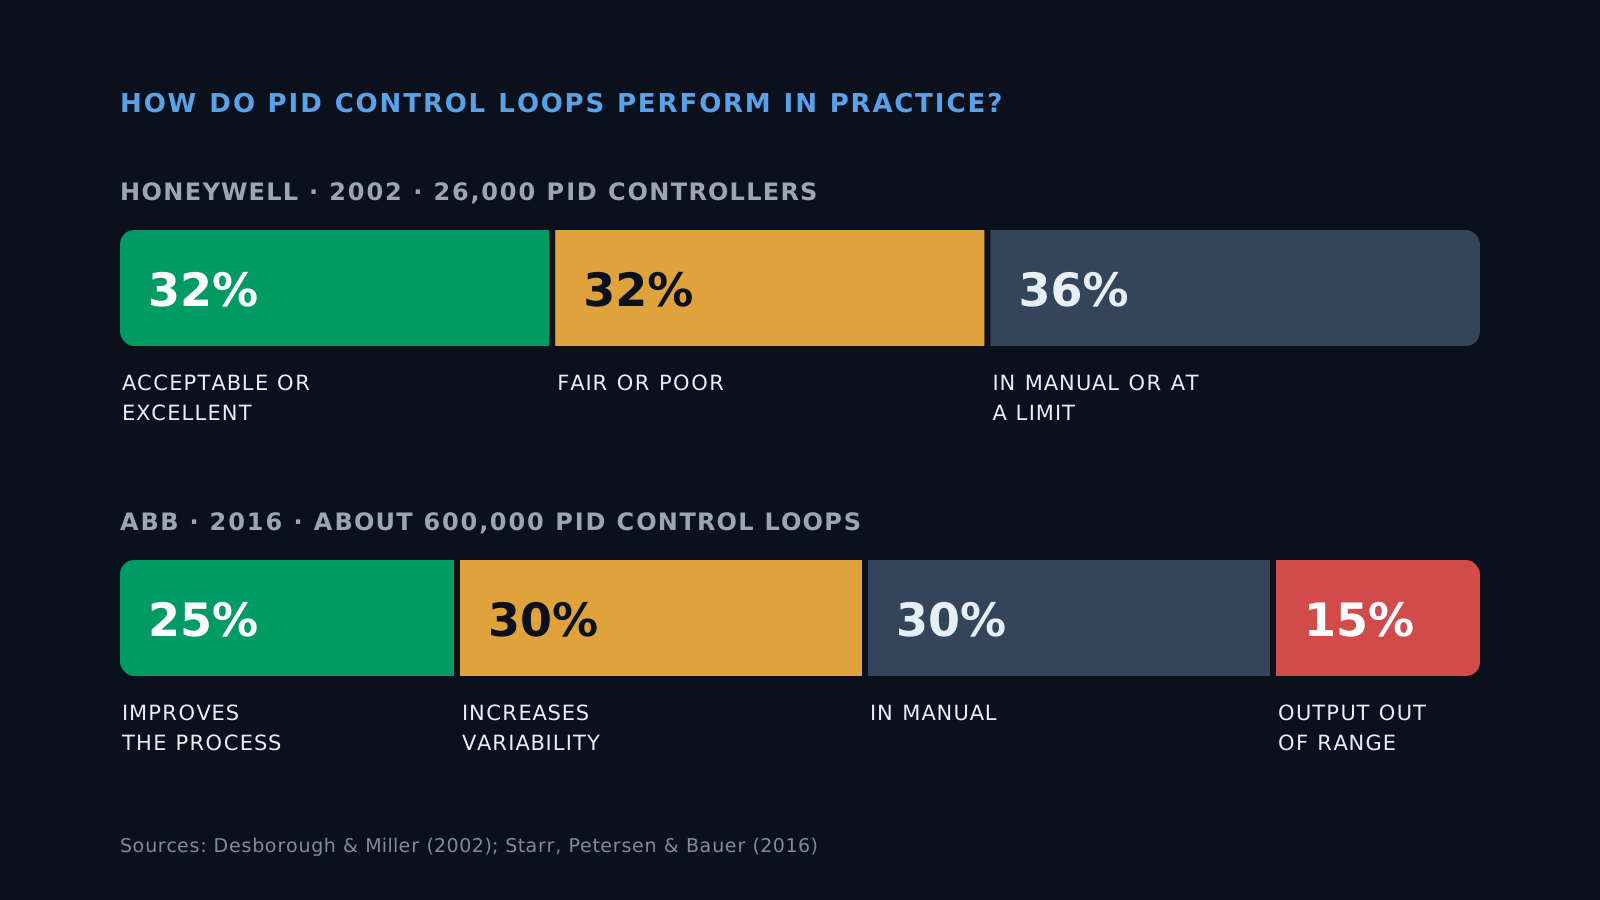
How do control loops perform in practice? What the research says
Research into hundreds of thousands of PID control loops keeps showing the same picture: a large share is in manual, oscillates or runs into a limit. The figures, the sources and the caveats.
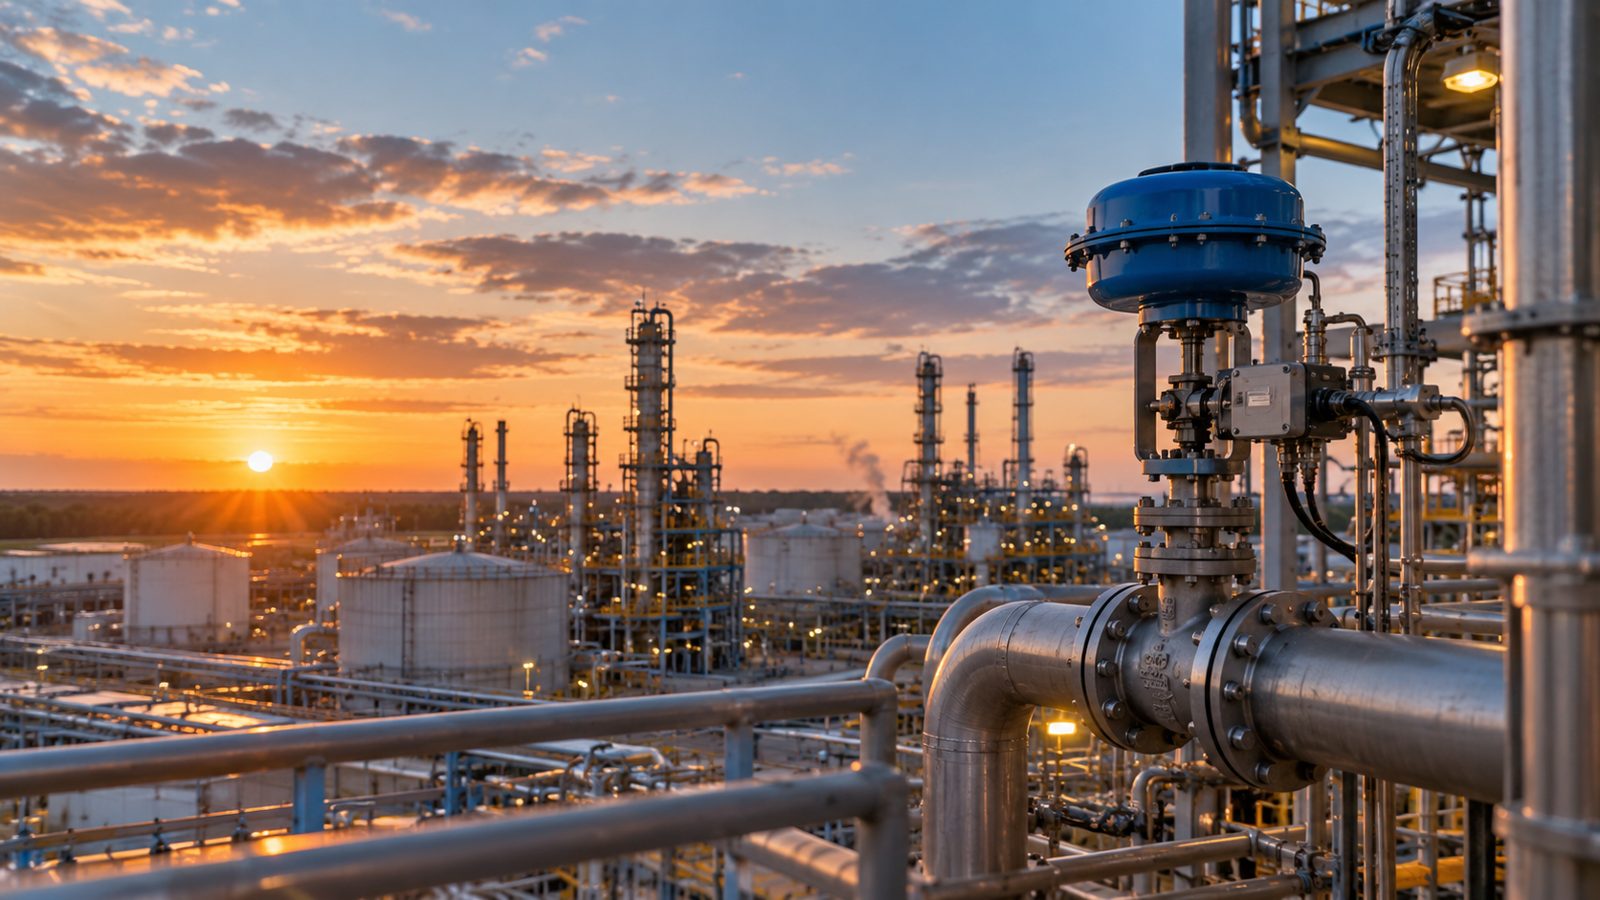
Process control: the basics of industrial control engineering
How does process control work in the process industry? Learn how feedback, feedforward and process dynamics come together in stable, well-performing control.
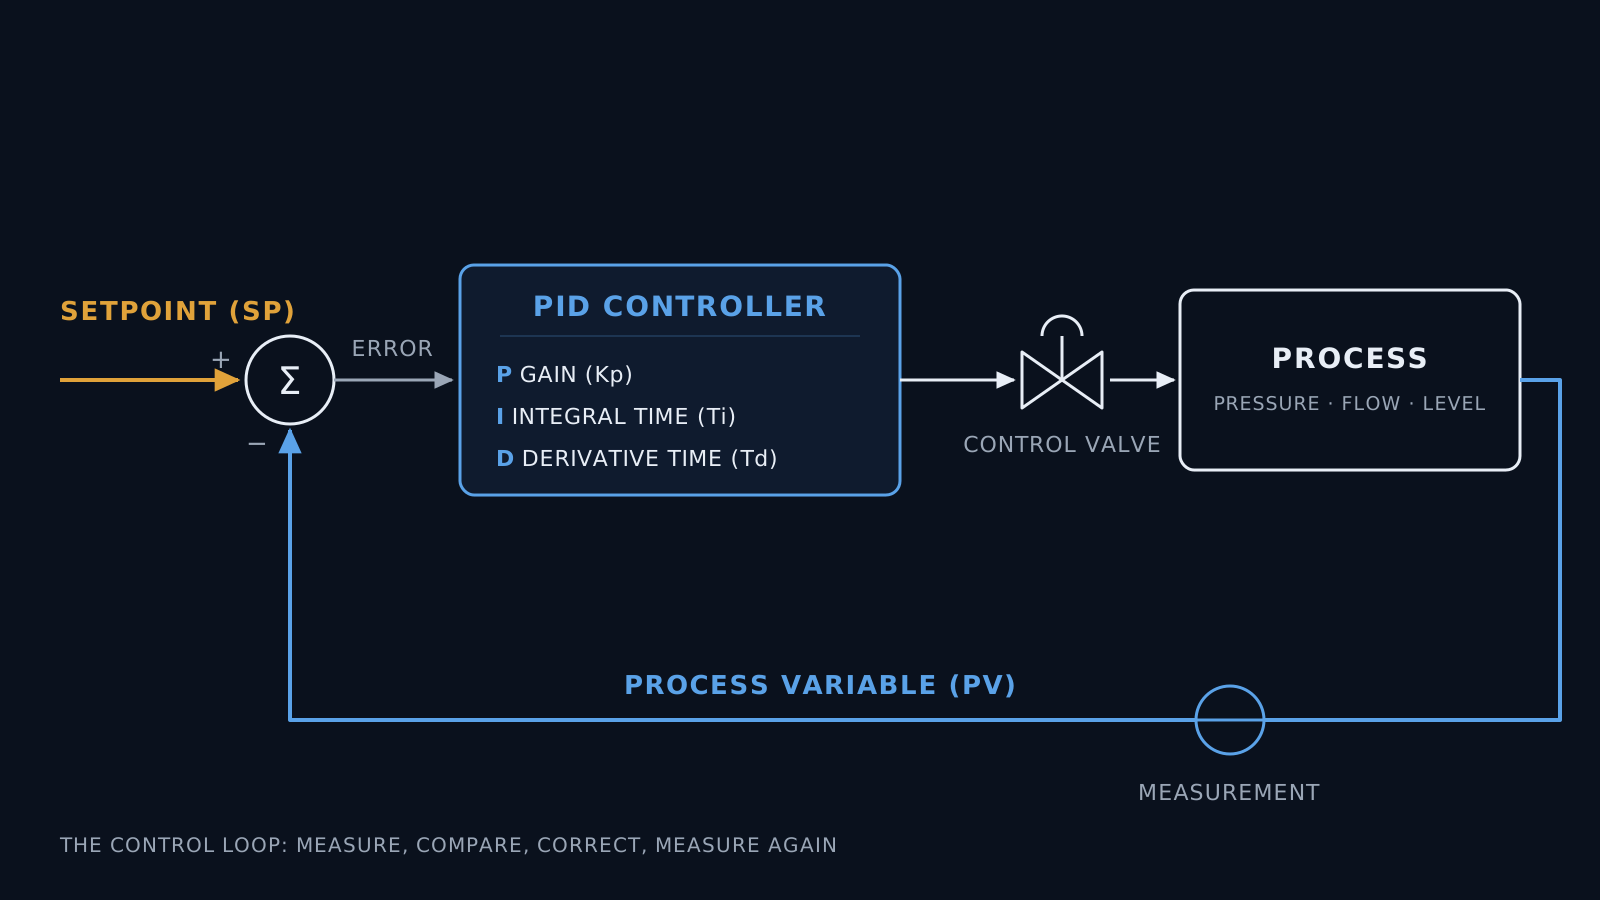
PID controller explained: how it works, settings and process dynamics
How does a PID controller work? Learn what P, I and D do, how process dynamics determine the right settings and how to recognise control behaviour in trend data.
Would you rather know what this means for your process?
Reading is a good start, but your own trend data tells the real story. The PID Performance Scan is free and shows where the unrest in your control loops comes from.