
Drum level control, from drum level to feedwater pump
A drum level, a feedwater valve and pumps moving up and down in the same rhythm. Now within a band half as wide, with 62% less valve movement.
In figures
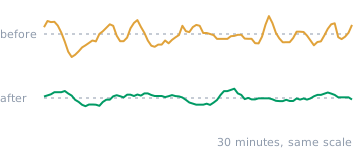
- Level variation −49% The drum level moves within a band half as wide around the setpoint.
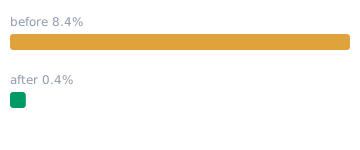
- Large level deviations −95% More than 10% of the trip band from setpoint: from 8.4% to 0.4% of the time.
- Valve movement −62% Each bar is one hour of feedwater valve movement. The same work, with far less travel.

- Fluctuation of valve differential pressure −87% The pumps now hold the pressure across the feedwater valve steady, instead of swinging along with the valve.

- Flow variation −50% The feedwater flow runs twice as evenly.
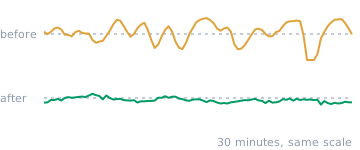
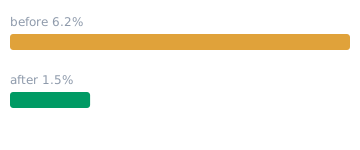
- Tracking error of the flow control −76% The flow control follows the master's demand much more accurately.
Within the safe band, but never at rest.
The drum level stayed within the safe band and no alarm went off. But in the trend data the level moved up and down continuously, in a rhythm of a few minutes, and the feedwater valve moved just as restlessly along with it. The drum level master reacted to every small level fluctuation, and the feedwater control below it carried out every correction immediately. That way the cascade kept setting itself in motion again and again.
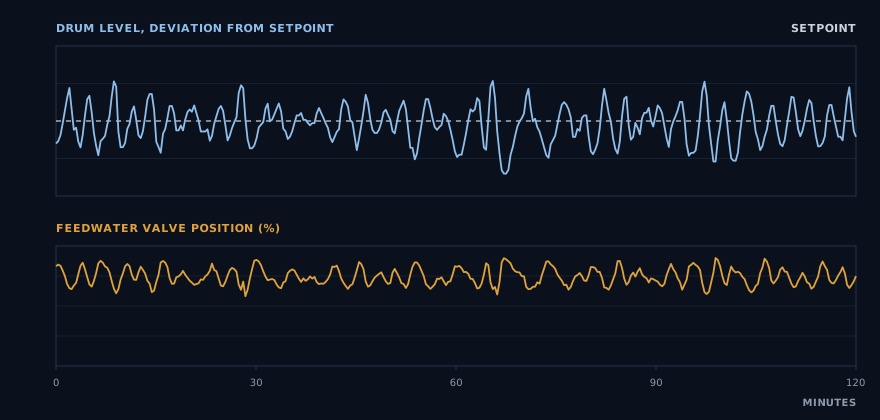
The pumps joined in too, in the same rhythm.
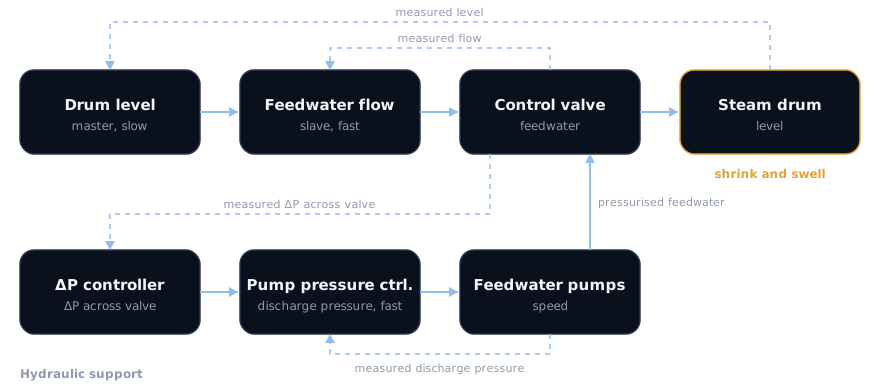
Below the cascade, the feedwater pumps keep the differential pressure across the valve at its level: a ΔP controller decides which discharge pressure is needed and a pump pressure controller adjusts the speed to achieve it. In the trend data that differential pressure moved in the same rhythm of about three minutes as the drum level.
When the valve opened further, the pressure across it dropped away, sometimes to a fifth of the setpoint. A valve with varying pressure across it lets a different flow through at the same position each time. So the flow control had to keep correcting, and drum level, valve and pumps kept each other in motion.
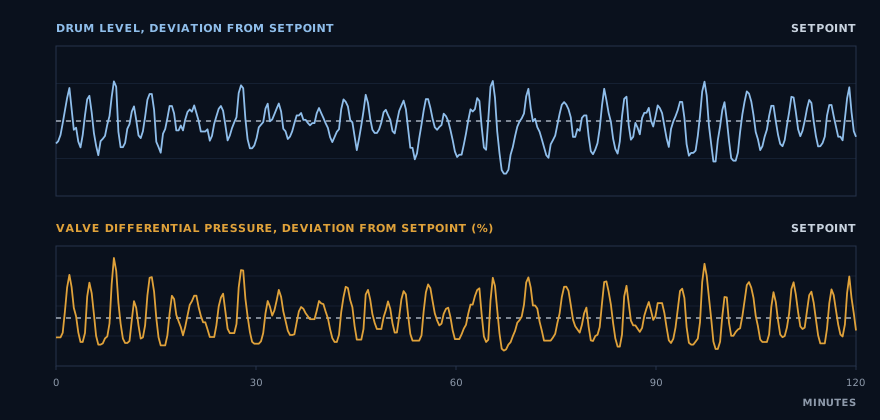
The same two hours as the chart above. At the top the deviation of the drum level from the setpoint, at the bottom the deviation of the differential pressure across the feedwater valve, as a share of the setpoint.
What showed on the drum came from the whole chain.
With a steam drum, calm is more than comfort: a level that keeps moving starts every load change from a worse position. Making one controller calmer does not help then, because the fluctuation sat in the interaction.
A master that reacts to shrink and swell corrects something that passes by itself. And a valve with varying pressure across it does not do what the flow control asks.
The goal became: let the master calmly guard the average level, let the flow control absorb the short changes and let the pumps keep the pressure across the valve constant.
The whole chain mapped, not one controller.
-
The chain mapped
How fast the drum level responds to a change in feedwater, how fast the flow control carries out the master's demand, how the differential pressure across the valve changes when the valve moves and how the pumps respond to that. And whether those controllers amplify or damp each other.
-
Four controllers tuned to each other
The master calmly guards the average level and the flow control absorbs the short changes. Below that, the ΔP controller and the pump pressure controller keep the pressure across the valve constant, without swinging along with the valve. They connect to each other instead of correcting the same deviation at the same time.
-
Without touching the plant
No extra measuring equipment and no downtime. Then measured again, on the same metrics.
A band half as wide, and a valve that moves 62% less.
The drum level now moves within a band half as wide around the setpoint. Deviations of more than 10% of the trip band, previously 8.4% of the time, now occur only 0.4% of the time, and the highest and lowest peaks stay further from the trip limits. The feedwater valve moves 62% less and the feedwater flow runs twice as evenly. The flow control also follows the master's demand much more accurately, so the cascade works as one whole.
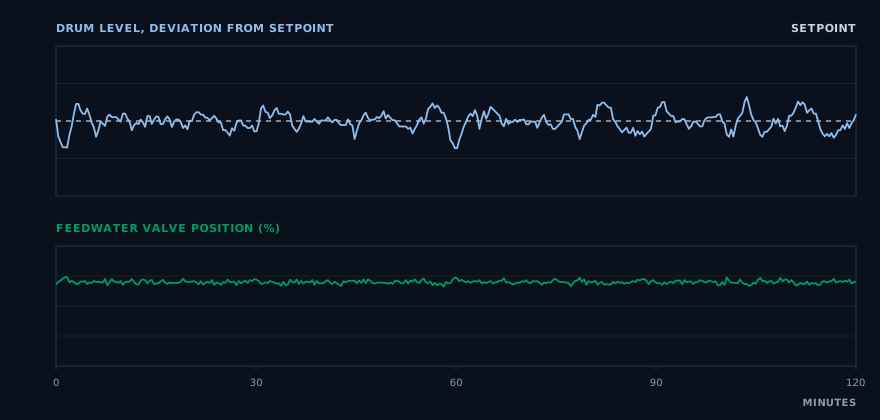
For each measurement period, the two hours that best represent the typical behaviour of that period, with the same duration and scale. At the top the deviation of the drum level from the setpoint, at the bottom the feedwater valve position.
And the pumps no longer need to move along.
The differential pressure across the valve used to be more than a quarter off its setpoint 62% of the time. Now it stays close to the setpoint almost all the time, and the three-minute rhythm has disappeared from the whole chain. The discharge pressure the pumps have to deliver needs 80% less correction. The valve always gets the same pressure across it, so the same valve position also gives the same flow.
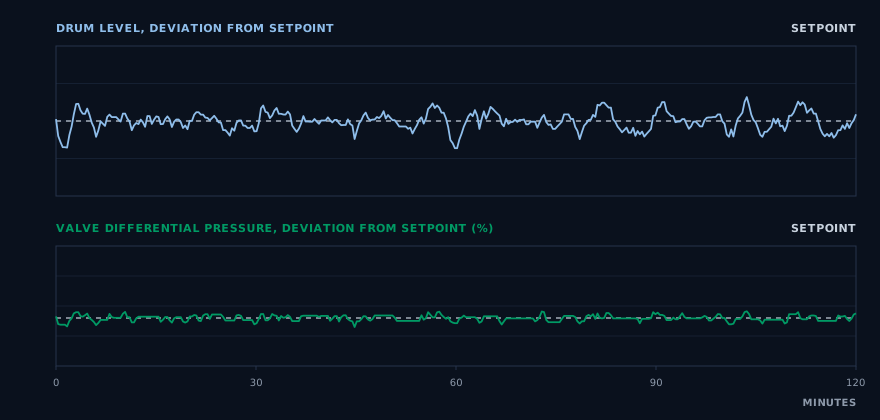
The same two hours as the chart above, on the same scale as before. At the top the deviation of the drum level, at the bottom the deviation of the differential pressure across the feedwater valve, as a share of the setpoint.
For those who want the details
The figures
| Metric | Before | After | Change |
|---|---|---|---|
| Level variation (σ) | 5.8% | 2.9% | −49% |
| Mean deviation from setpoint | 4.7% | 2.3% | −51% |
| Largest deviation, 99% of the time | 15.3% | 8.3% | −46% |
| Time more than 10% of the trip band from setpoint | 8.4% | 0.4% | −95% |
| Highest peak, share of the room to the high trip | 49% | 39% | 10 percentage points more margin |
| Lowest peak, share of the room to the low trip | 41% | 33% | 8 percentage points more margin |
| Feedwater valve movement (total per hour) | index 100 | index 38 | −62% |
| Flow variation (σ as a share of mean flow) | 16.4% | 8.2% | −50% |
| Mean flow change per 20 seconds | 7.1% of mean | 1.9% of mean | −74% |
| Tracking error of the flow control (σ) | 6.2% of mean | 1.5% of mean | −76% |
| Variation of valve differential pressure (σ as a share of setpoint) | 43% | 5.8% | −87% |
| Time differential pressure more than 25% off setpoint | 62% | 0.02% | almost never any more |
| Lowest differential pressure across the valve, as a share of setpoint | 21% | 72% | more than three times as high |
| Movement of the requested discharge pressure (total per hour) | index 100 | index 20 | −80% |
How we measure
All figures come from the existing historian. For the drum level and its setpoint, the requested and measured feedwater flow and the valve position, these are 20-second values over five days of continuous operation per period. For the differential pressure across the valve and the requested pump discharge pressure, they are 2-second values over four days of the same periods.
Valve movement is the sum of all changes in valve position per hour (total valve travel), and the movement of the requested discharge pressure is calculated in the same way. Level figures are given as a share of the trip band (the distance between low and high trip), flow figures as a share of the mean flow and pressure figures as a share of the setpoint, so that a difference in load or setpoint does not distort the picture.
The margin to the trip limits is the highest and lowest level value as a share of the distance between setpoint and trip. For each period, the charts show the two hours whose figures are closest to the typical behaviour of that period, not the best or worst two hours.
Caveats
- The mean feedwater flow was 11% lower after the optimisation; that is why the flow figures are given as a share of the mean.
- After the optimisation the valve makes more, but much smaller steps. That is why we use total valve travel as the measure, not the number of direction changes.
- The setpoint of the differential pressure across the valve was slightly higher after the optimisation than before. That is why all pressure figures are given as a share of the setpoint.
- The drum level setpoint and the trip limits were the same in both periods.
Further reading
- Article
PID controller explained: how it works, settings and process dynamics
How does a PID controller work? Learn what P, I and D do, how process dynamics determine the right settings and how to recognise control behaviour in trend data.
- Case study
NOₓ trim controller, SCR ammonia dosing
A controller that corrected more than 40 times per hour and consistently came out too high. Now closer to the setpoint, with half as much correcting.
Does your process move more than necessary too?
The only way to know what there is to gain is to look at your data. We do that in the free PID Performance Scan, and it starts with a no-obligation introduction.