
NOₓ trim controller, SCR ammonia dosing
A controller that corrected more than 40 times per hour and consistently came out too high. Now closer to the setpoint, with half as much correcting.
In figures
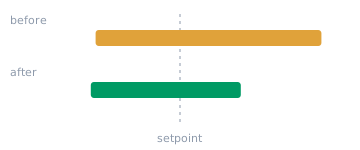
- Spread around setpoint −49% The band within which the NOₓ value stays 95% of the time has become a lot narrower, especially at the top.
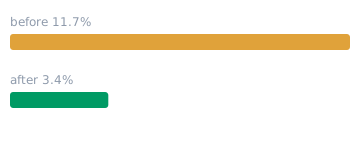
- Time well above setpoint −71% More than 20% above setpoint: from 11.7% to 3.4% of the time.
- Controller output movement −49% Each bar is one hour of controller movement. The same work, with half as much correcting.

- Mean deviation from setpoint −1.5% Was +5.7%: the controller consistently came out too high, now practically on setpoint.

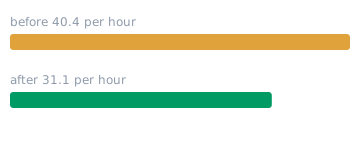
- Direction changes −23% The controller output changes direction less often: from 40.4 to 31.1 times per hour.
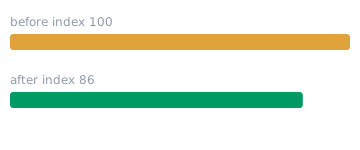
- Ammonia slip −14% Less unused ammonia downstream of the catalyst.
Neatly within the margins. And still correcting more than 40 times per hour.
Nobody saw a problem. The NOₓ value stayed neatly within the margins and no alarms went off. But something stood out in the trend data: the controller output never came to rest. More than 40 times per hour the controller changed direction, even when nothing was going on, and almost a third of the time it sat at its maximum output. Every small deviation was corrected immediately, and every correction caused a new deviation in turn.
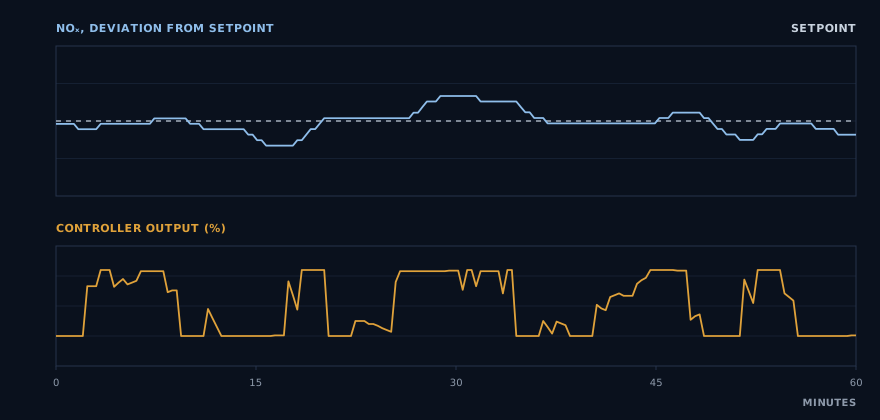
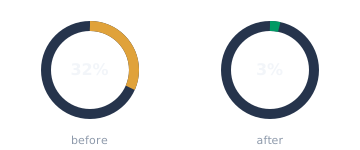
A controller that runs into its limit that often has no room left for a real disturbance. After the optimisation that is 3% of the time.
The question was not whether the controller worked, but whether it could do the same with less effort.
A controller this active costs money in places that do not appear in an emissions report: the dosing valve and pump wear faster, the ammonia dosing fluctuates and the catalyst is loaded unevenly. The goal therefore became: react more calmly to small deviations, without becoming slower on real disturbances.
From the historian data, without step tests or downtime.
-
Process dynamics determined
How long it takes before a change in dosing becomes visible in the NOₓ measurement, and how fast and how strongly the process responds after that.
-
Settings calculated
Based on that, the PI settings, the dead band and the limits of the controller output were recalculated.
-
Implemented and measured
The new settings were implemented during normal operation and then measured again, on the same metrics.
Closer to the setpoint, with half as much correcting.
The NOₓ value stays closer to the setpoint: the spread fell by 49% and the time the value was more than 20% above the setpoint fell by 71%. On average the controller now controls practically on setpoint, where it used to come out consistently too high. At the same time the controller output moves half as much and sits at its maximum only 3% of the time, so there is control room left for real disturbances. The ammonia slip fell by 14%, and slightly less ammonia is needed per amount of NOₓ removed.
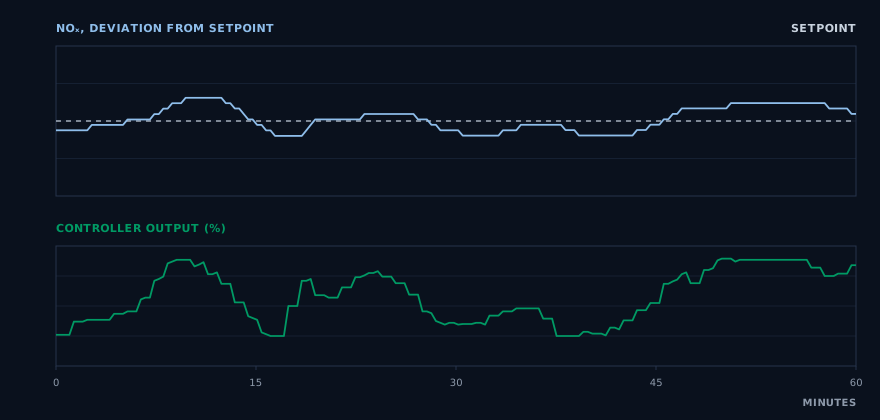
For each measurement period, the hour that best represents the typical behaviour of that period, with the same duration and scale. At the top the deviation from setpoint, at the bottom the controller output.
For those who want the details
The figures
| Metric | Before | After | Change |
|---|---|---|---|
| Mean deviation from setpoint | +5.7% of SP | −1.5% of SP | practically on setpoint |
| Spread around setpoint (σ) | 31.7% of SP | 16.0% of SP | −49% |
| Largest deviation, 95% of the time | 45% of SP | 24% of SP | −46% |
| Time above setpoint | 60% | 44% | −27% |
| Time more than 10% above setpoint | 29% | 15% | −48% |
| Time more than 20% above setpoint | 11.7% | 3.4% | −71% |
| Direction changes of the controller output | 40.4 per hour | 31.1 per hour | −23% |
| Controller output movement (total per hour) | index 100 | index 51 | −49% |
| Controller output at maximum | 32% of the time | 3% of the time | −89% |
| Step size of ammonia dosing | 4.2% of mean | 3.6% of mean | −15% |
| Ammonia per NOₓ removed | index 100 | index 98.7 | −1.3% |
| Ammonia slip (mean) | index 100 | index 86 | −14% |
How we measure
All figures are calculated from the 20-second values of the existing historian, over normal operation only: plant running and controller active. Deviations are given as a percentage of the setpoint. A direction change counts when the controller output reverses after a step of more than 0.5% of its range; the controller output movement is the sum of all steps per hour. Ammonia per NOₓ removed is the total dosing divided by the total difference in NOₓ upstream and downstream of the catalyst. For each period, the charts show the hour whose figures are closest to the typical behaviour of that period, not the best or worst hour.
Caveats
- The measurement period before covered about 10 days of normal operation, the period after about 6 days. Where the length differs, we calculate per hour or as a share of the time.
- The maximum controller output was also widened during the optimisation. The smaller share of time at the maximum is partly due to that.
- The total spread of the ammonia dosing increased slightly (+11%). It mainly follows the varying NOₓ load; the dosing does move in smaller steps.
Further reading
- Article
PID controller explained: how it works, settings and process dynamics
How does a PID controller work? Learn what P, I and D do, how process dynamics determine the right settings and how to recognise control behaviour in trend data.
- Case study
Drum level control, from drum level to feedwater pump
A drum level, a feedwater valve and pumps moving up and down in the same rhythm. Now within a band half as wide, with 62% less valve movement.
How often does your controller correct when it does not need to?
The only way to know what there is to gain is to look at your data. We do that in the free PID Performance Scan, and it starts with a no-obligation introduction.